Peter Brandt’s Bitcoin Price Prediction Signals Rally to $150K by September 2025


Veteran trader Peter Brandt has sparked significant discussion in the cryptocurrency community with his latest Bitcoin price analysis. Brandt, known for his accurate predictions, including the 2018 Bitcoin crash, uses a parabolic arc pattern to forecast a potential surge to $125,000 to $150,000 by August or September 2025. However, he also warns of a steep correction following this peak, highlighting the volatile nature of Bitcoin’s market cycles. This analysis, rooted in technical charting and market factors, offers valuable insights for investors.
Brandt’s prediction comes at a time when Bitcoin is currently rallying at $96,977 heading toward $100K. As Bitcoin hovers near a critical technical level, understanding Brandt’s perspective and the broader market dynamics is essential for investors seeking to capitalize on potential opportunities.
Parabolic Arc Pattern and Market Dynamics
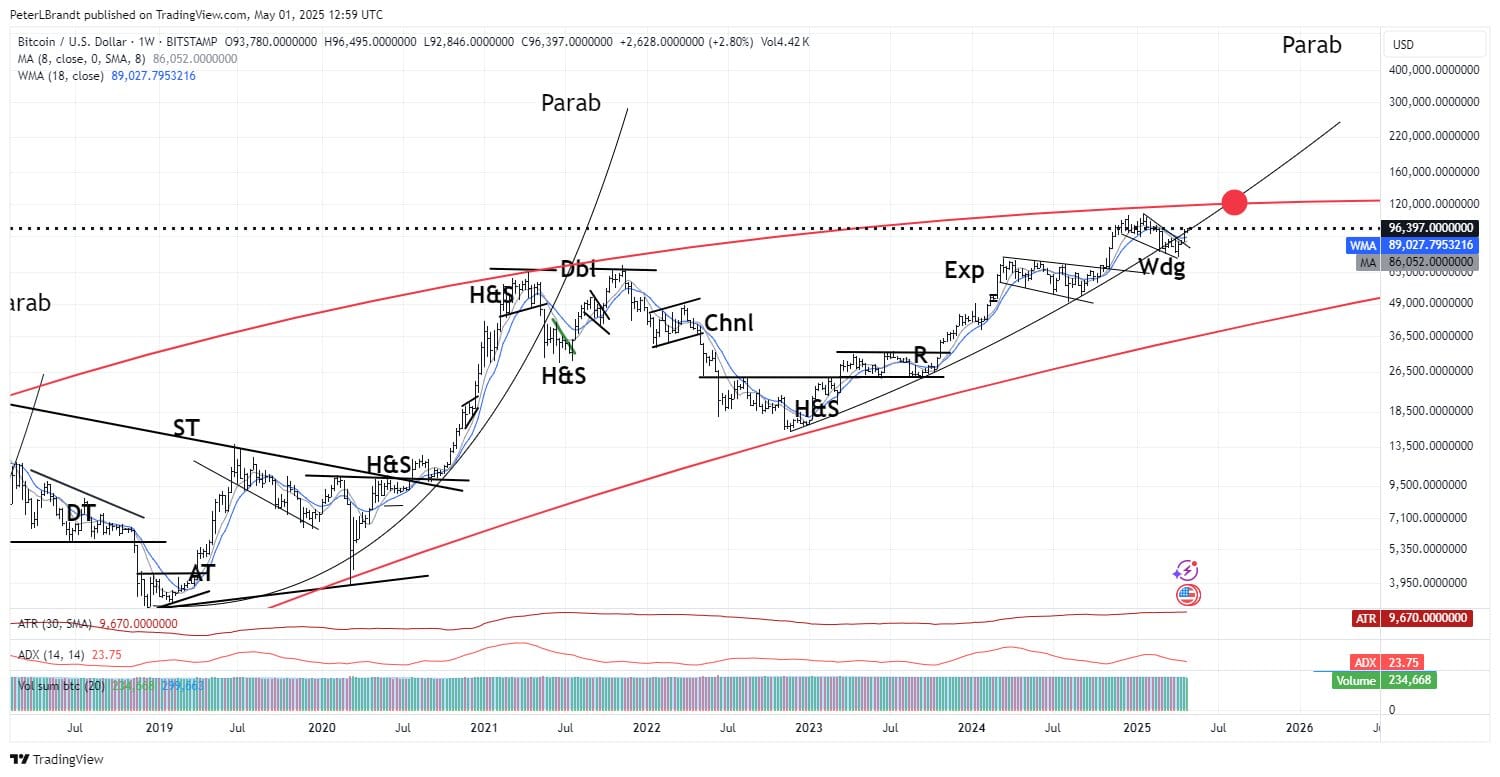
Brandt’s analysis centers on a weekly Bitcoin price chart against the US dollar, spanning from 2018 to a projected point in late 2025. The chart, sourced from TradingView, features a parabolic arc pattern, which Brandt labels as “Parab.” This pattern is characterized by a gradual price increase followed by an exponential surge, often driven by intense market greed, before culminating in a sharp correction fueled by fear. Brandt has drawn two red parabolic curves on the chart: a lower curve that Bitcoin has historically followed and an upper curve projecting the potential peak of the current cycle.
Currently, Bitcoin’s price has dipped below the lower parabolic curve, a level Brandt refers to as the “broken parabolic slope.” He suggests that if Bitcoin can reclaim this level, it could resume its upward trajectory, potentially reaching $125,000 to $150,000 by mid-to-late 2025. The chart also includes annotations like “H&S” (Head and Shoulders patterns) and “Exp” (Exponential rise), which highlight past price action within the parabolic framework. These technical markers underscore Brandt’s view that Bitcoin’s current cycle mirrors previous bullish phases, such as the 2017 rally that preceded a significant crash.
The parabolic arc pattern is deeply tied to market psychology, where greed drives rapid price increases as investors rush to buy, fearing they will miss out on gains. This phase is often followed by fear-driven sell-offs when the market becomes overextended, as seen in Bitcoin’s historical 50%+ corrections. Brandt’s warning of a similar correction after the projected peak emphasizes the risks of entering the market at its height. The Crypto Market Sentiment analysis, a tool for gauging market sentiment, could provide further clues about when greed or fear is dominating, helping investors time their decisions.
Brandt’s price target aligns with other forecasts, such as InvestingHaven’s prediction of $125,000 to $155,000 for 2025, adding credibility to his analysis. However, the broken parabolic slope introduces uncertainty, as failure to reclaim this level could invalidate the pattern and lead to consolidation or a decline. Investors are thus faced with a critical moment, as Bitcoin’s ability to break above the current price level will determine whether the bullish scenario unfolds.
For investors, Brandt’s analysis presents both opportunity and risk. A successful reclaiming of the parabolic slope could yield significant gains, with a 30-55% increase from the current price to the projected $125,000 to $150,000 range. However, the anticipated correction could erase half of those gains, posing challenges for those entering late. As Bitcoin approaches a pivotal moment, Brandt’s chart offers a compelling roadmap for understanding its potential trajectory in 2025.