Bitcoin Price Falls Below $87,000 as $200 Million Longs Vanish


Bitcoin experienced a sharp decline on Monday, falling below the $87,000 level during early morning hours. This sudden move wiped out nearly $200 million in leveraged long positions within a single hour, highlighting the risks associated with high-leverage trading in volatile markets. Traders who had positioned for continued upward momentum faced automatic closures as prices breached key thresholds.
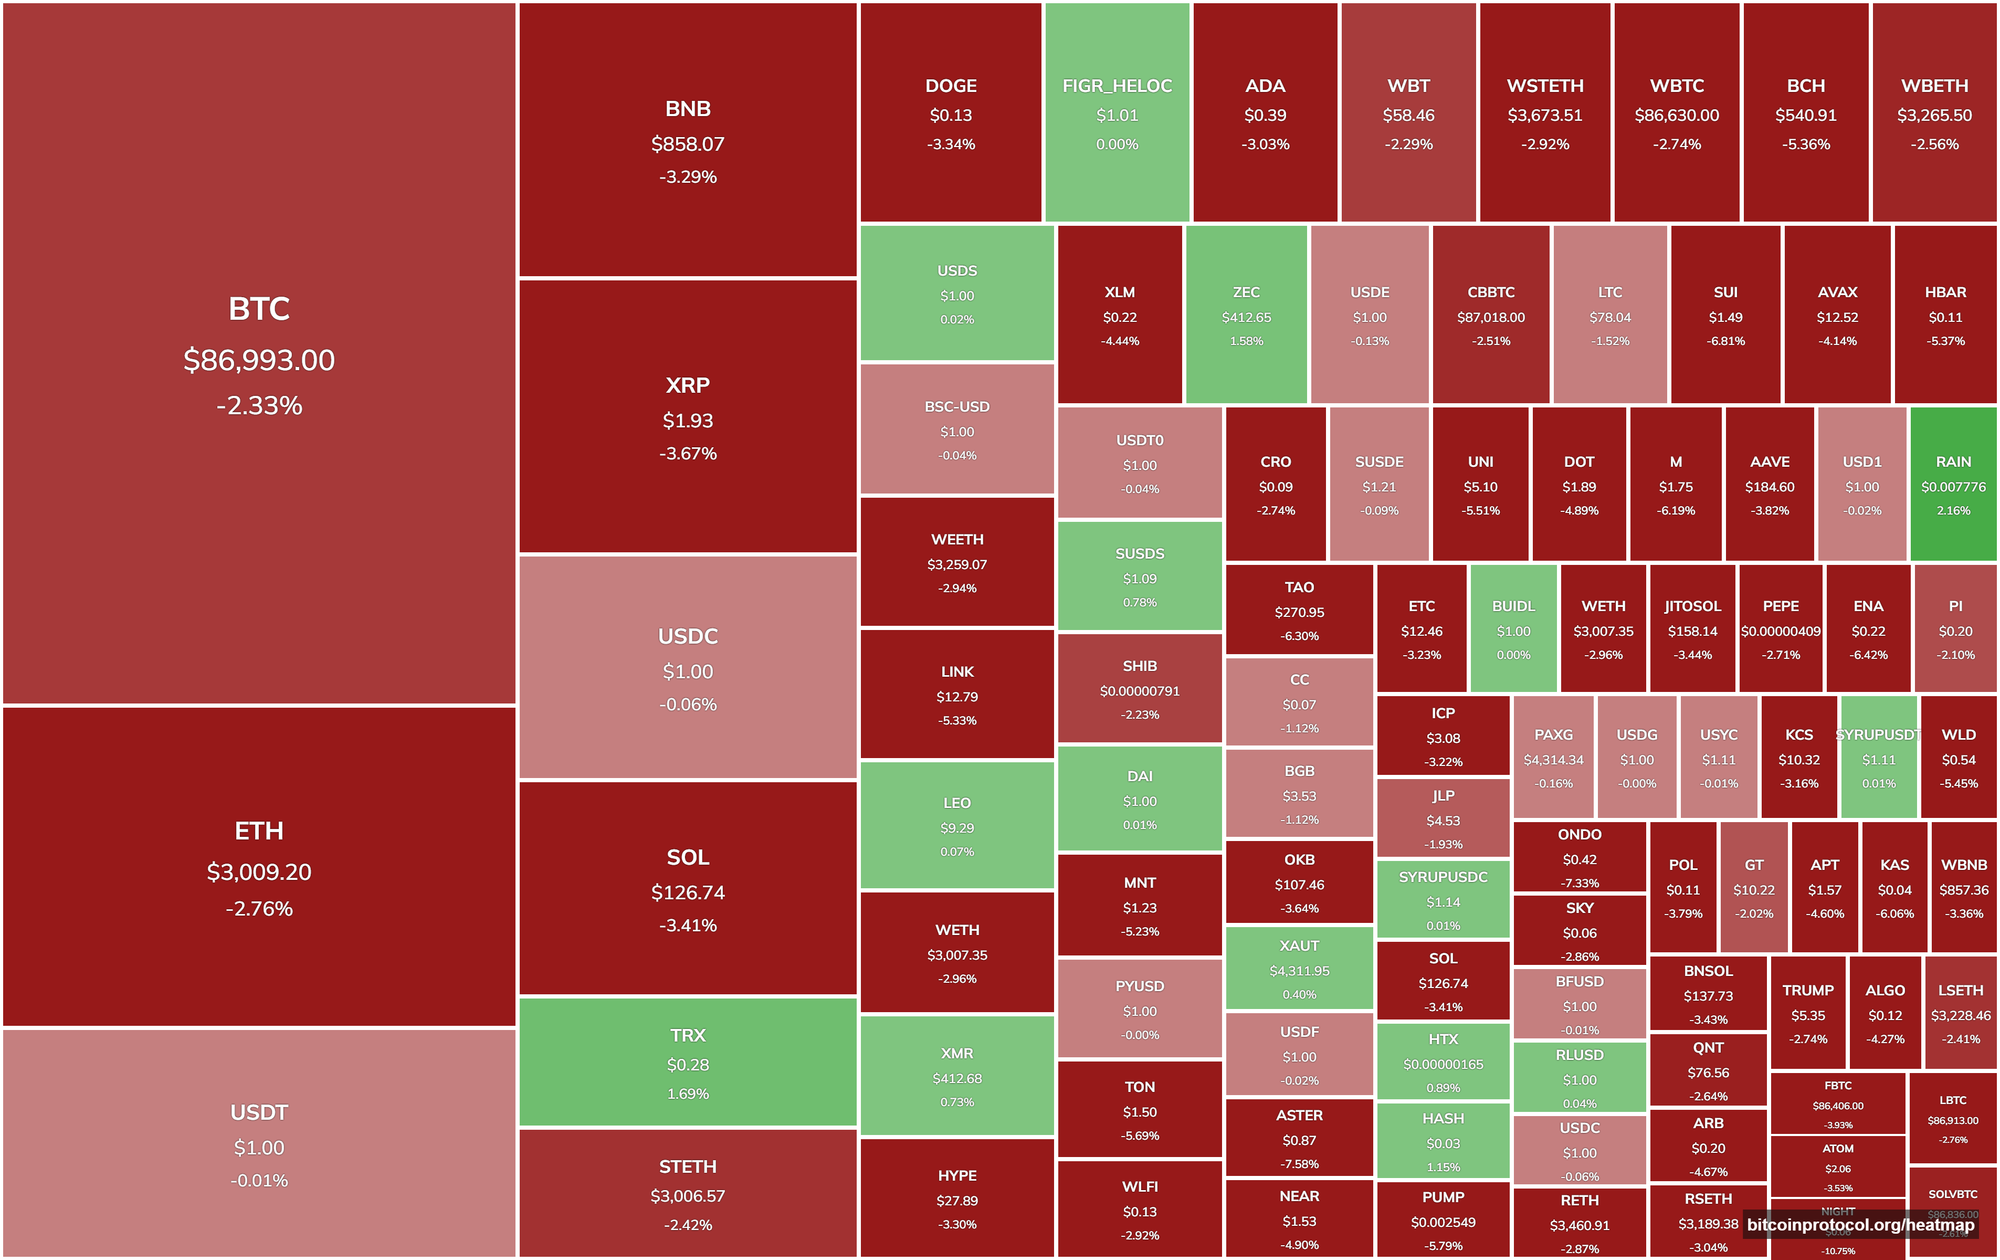
The drop extended beyond Bitcoin, affecting the broader cryptocurrency landscape. Major assets like Ethereum, Solana, and others, each recorded losses of around 4% in the same short period. Such synchronized declines often reflect interconnected market dynamics where Bitcoin's movements influence altcoin performance.
Factors Contributing to the Market Pullback
Several elements appeared to drive the recent weakness in Bitcoin's price action. Overleveraged long positions created vulnerability, with funding rates indicating traders were paying premiums to maintain bullish bets. When the price turned lower, these positions triggered a cascade of forced selling that amplified the downside pressure.
Activity during U.S. trading sessions also played a role, as Bitcoin showed patterns of underperformance when American markets were open. Related stocks, including those tied to prominent Bitcoin holders, saw notable declines, suggesting institutional rebalancing or hedging influenced the flow of capital. Open interest in Bitcoin futures on regulated exchanges had increased, pointing to preparatory moves ahead of significant economic announcements.
Broader macroeconomic conditions added another layer of caution among participants. Upcoming U.S. jobs data and central bank decisions from institutions like the Bank of Japan, Bank of England, and European Central Bank were on the horizon. A strengthening dollar index near recent highs tended to weigh on risk-sensitive assets, including cryptocurrencies, as investors assessed potential delays in monetary policy easing.
Liquidation data revealed critical levels that traders are monitoring closely. Support zones around $85,000 stand out on longer-term heatmaps, with further technical markers like Fibonacci retracements highlighting areas below that could come into play if selling persists. On the upside, a recovery above certain moving averages would indicate shifting momentum.
Market sentiment indicators currently reflect a mix of trends, with some areas showing growth while others face challenges, with both positive and negative indicators, with an overall neutral balanced sentiment but trending bearish based on the latest readings and indicators. Current price levels present tests of key supports established in recent months. Crypto traders are evaluating whether upcoming data releases will provide clarity or extend the prevailing uncertainty.